Association of Performing Arts Professionals logo

APAP releases Arts Compensation Project Data and Trend Report

A study of compensation at performing arts presenting organizations in partnership with AMS Analytics, the report is the product of a multi-year initiative to help the performing arts presenting, booking, and touring field track compensation and demographic data about professionals working in performing arts presenting organizations and venues of various sizes and types across the U.S.
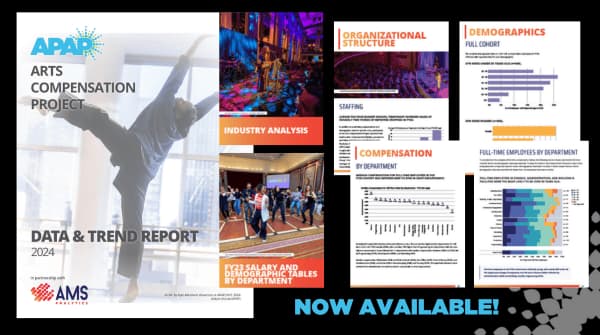
The cover of the Arts Compensation Project Data and Trend Report along with six pages from inside the report, highlighting the special sections of the report.

Why is this report important?

The pandemic hastened a talent drain as organizations shrunk or closed and workers shifted away from the arts, making hiring and retaining staff as performing arts organizations reopened more urgent.

“The post-2020 environment was ripe for APAP to revive and turbo-charge this work and to build on recent initiatives aimed at promoting pay transparency and best practices across the presenting, booking and touring field,” remarks Krista Bradley, APAP Director of Programs and Resources, who leads the Project.

The purpose of gathering this data is to strengthen the performing arts industry by making it more transparent and competitive with other industries.

“It’s essential that the performing arts field retain the invaluable talent we already have in our organizations and attract new talent to the performing arts workforce.” APAP President and CEO Lisa Richards Toney urges, “APAP’s role is to strengthen the field, and key to strengthening it is that the performing arts must be competitive on par with other industries. This new report is central to that charge.”  

What's unique about the report?

The report was crafted specifically with data from performing arts presenting organizations, whose operating models and multidisciplinary lenses differ from discipline-specific performing arts organizations and other not profits. The data collected represents positions at all levels and departments within presenting organizations, providing data not previously captured by other publicly available reports on not-for-profit senior leadership compensation.

What's in the report?

The 2024 Arts Compensation Project Data and Trend Report looks at compensation and demographic data from FY23, submitted by 65 performing arts presenting organizations for over 1,000 arts workers, as well as including some longitudinal data from FY21 and FY22. Participating organizations came from 28 states across all regions of the U.S., with budgets ranging from under $500K to $13M. Just under 60% were independent not-for-profit presenters, with university/college presenters, municipal presenting organizations, and festivals making up the balance. 

The report is 60 pages long. Compensation data, which makes up most of the report, includes base salary, bonus and incentives, deferred compensation, other reportable compensation, and other non-taxed benefits. The report includes 10th, 25th, 50th, 75th and 90th percentiles for total compensation for seven management levels, in the following departments: Administration, Box Office, Development, Education, Events, Finance, Marketing, Operations, Production, and Programming. The report has more than 90 graphs and tables illustrating the data. 

Additionally, the report provides demographics of the reporting cohort, principal administrators, new hires, and breakdowns of departments by age, gender, race, and education level. It also provides data on the ratio of permanent to temporary workers and insights on the leadership structures and hierarchy of positions within differently sized organizations.  

APAP Members: Login and Download the Report

Key Findings: 

  • The workforce has limited diversity in several areas. The workforce reported by our sample was relatively young, majority female, highly educated, and predominantly White. Among employees for whom data was reported for each demographic, 67% were under 50, 60% were women, 79% held a bachelor’s degree or higher, and 84% were White.
     
  • Reliance on temporary staff is high and may be growing. Across different budget sizes, participating organizations reported that temporary workers (non-permanent part-time or seasonal positions) represented roughly two-thirds of total staffing in FY23. Early longitudinal data shows rapid growth in total staff sizes over the past three years, capturing a rebound effect as the industry has come out of the pandemic. Between FY21 and FY23, the average number of employees per organization increased by 43%, driven by a 66% increase in temporary positions. During the same period, the number of full-time positions rose 22% and part-time permanent positions remained flat, suggesting both that organizations are re-staffing and that the field’s reliance on temporary workers may be increasing. 

  • Department-level compensation trends vary widely. Within our sample, median compensation for full-time employees in FY23 was between $60K and $70K in most departments, while the median for Principal Administrators (Executive Directors, etc.) was $143K. Finance was the department with the highest median compensation, at $85K. At participating organizations where longitudinal data was present, the overall median compensation increased 7.5% from FY21 to FY23. This varied significantly between departments, however, ranging from a 33% increase in Education to a 7% decrease in Communications. 

  • Since FY21 the lowest-paid workers have seen higher proportional gains. Looking at compensation in terms of Management Level—seniority of role—our longitudinal data also shows that an increase in median compensation between FY21 and FY23 varied by Level, with less senior levels seeing larger percentage increases. Median compensation in Level 4 (e.g., Associates) rose by 20%, while median compensation for Principal Administrators (Executive Directors, etc.) rose only 6.5%. 
Want to be part of the Arts Compensation Project? Enrollment is open!
APAP Members: Login and Download the Report
 Spring 2024 enrollment is about to open.
Interested in the Arts Compensation Project? 
Email us at ACP@apap365.org.
The Arts Compensation Project Data & Trend Report is available to current APAP members. Learn more about becoming an APAP member.

The APAP Arts Compensation Project is funded in part by the Doris Duke Charitable Foundation, Ford Foundation, the Mellon Foundation, and the Wallace Foundation.

  1. First, complete the enrollment form which will ask you for organizational and budget information to determine your eligibility and subscription rate.

  2. Next, once you get confirmation from APAP on your eligibility and subscription rate, review and agree to the terms and conditions of the ACP.
     
  3. Then, once you have signed the terms and conditions, APAP will send you an invoice after which you will submit payment for your ACP subscription.

  4. Lastly, once payment has been received, you will get instructions from APAP and AMS on how to access the platform, including information about onboarding. The process of onboarding will begin September 12, 2023 and entering your data will begin October 2, 2023.

Meet the Class of 2022

Please read the application guidelines and preview before applying.

Copyright © 2024 - APAP - All Rights Reserved
© Copyright - APAP - 2024 | Website built by Argent Innovations LLC All Rights Reserved
envelopephone-handsetmap-markerchevron-down linkedin facebook pinterest youtube rss twitter instagram facebook-blank rss-blank linkedin-blank pinterest youtube twitter instagram