Why is this report important?
The pandemic hastened a talent drain as organizations shrunk or closed and workers shifted away from the arts, making hiring and retaining staff as performing arts organizations reopened more urgent.
“The post-2020 environment was ripe for APAP to revive and turbo-charge this work and to build on recent initiatives aimed at promoting pay transparency and best practices across the presenting, booking and touring field,” remarks Krista Bradley, APAP Director of Programs and Resources, who leads the Project.
The purpose of gathering this data is to strengthen the performing arts industry by making it more transparent and competitive with other industries.
“It’s essential that the performing arts field retain the invaluable talent we already have in our organizations and attract new talent to the performing arts workforce.” APAP President and CEO Lisa Richards Toney urges, “APAP’s role is to strengthen the field, and key to strengthening it is that the performing arts must be competitive on par with other industries. This new report is central to that charge.”
What's unique about the report?
The report was crafted specifically with data from performing arts presenting organizations, whose operating models and multidisciplinary lenses differ from discipline-specific performing arts organizations and other not profits. The data collected represents positions at all levels and departments within presenting organizations, providing data not previously captured by other publicly available reports on not-for-profit senior leadership compensation.
What's in the report?
The 2024 Arts Compensation Project Data and Trend Report looks at compensation and demographic data from FY23, submitted by 65 performing arts presenting organizations for over 1,000 arts workers, as well as including some longitudinal data from FY21 and FY22. Participating organizations came from 28 states across all regions of the U.S., with budgets ranging from under $500K to $13M. Just under 60% were independent not-for-profit presenters, with university/college presenters, municipal presenting organizations, and festivals making up the balance.
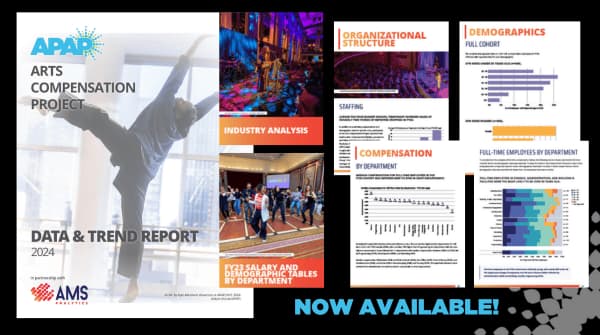
The report is 60 pages long. Compensation data, which makes up most of the report, includes base salary, bonus and incentives, deferred compensation, other reportable compensation, and other non-taxed benefits. The report includes 10th, 25th, 50th, 75th and 90th percentiles for total compensation for seven management levels, in the following departments: Administration, Box Office, Development, Education, Events, Finance, Marketing, Operations, Production, and Programming. The report has more than 90 graphs and tables illustrating the data.
Additionally, the report provides demographics of the reporting cohort, principal administrators, new hires, and breakdowns of departments by age, gender, race, and education level. It also provides data on the ratio of permanent to temporary workers and insights on the leadership structures and hierarchy of positions within differently sized organizations.
Key Findings: